Translate
Energy efficiency
Learn how our Energy Program is improving the energy efficiency of our wastewater treatment process and its operations.

Producing clean water is a very energy-intensive process. The amount of energy the Wastewater Treatment Division (WTD) uses in its wastewater treatment depends on internal factors such as age and the efficiency of its current equipment and external factors like rainfall, air temperature, and regional population. The Energy Program considers these factors when collecting and analyzing data to help WTD prioritize its resources and make informed operational decisions. The process is called energy normalization, and we create a baseline of energy consumption and track our progress toward reduction annually.
Energy conservation
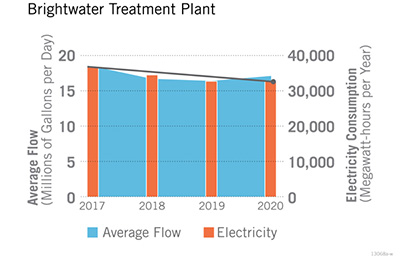
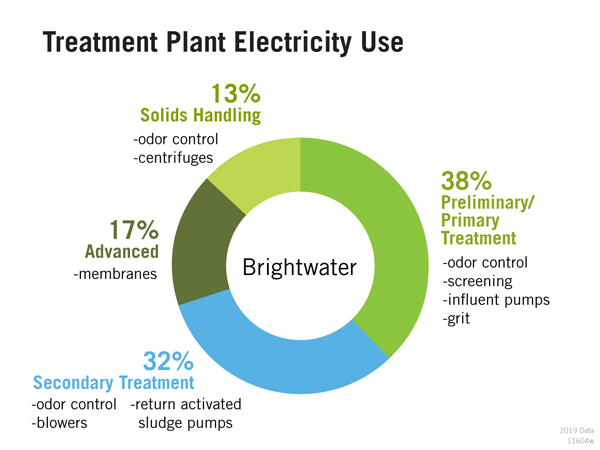
From 2017 to 2020, Brightwater Treatment Plant showed a consistent drop in electricity use resulting in lower energy costs year-to-year, although the average wastewater flow remained relatively constant. In 2020, these energy savings lowered electricity costs at Brightwater by $280,000. This is savings the treatment plant will have every year going forward.
Energy use
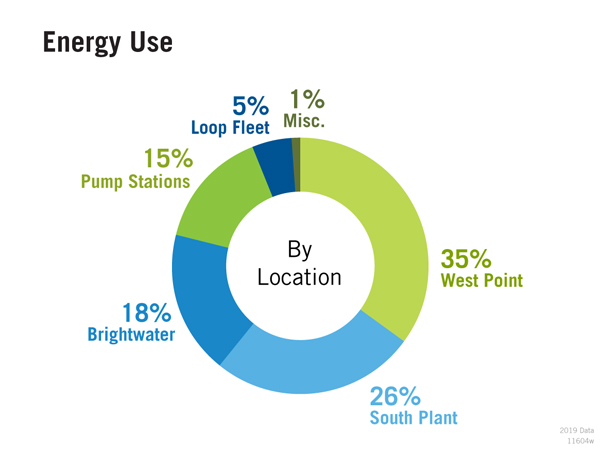
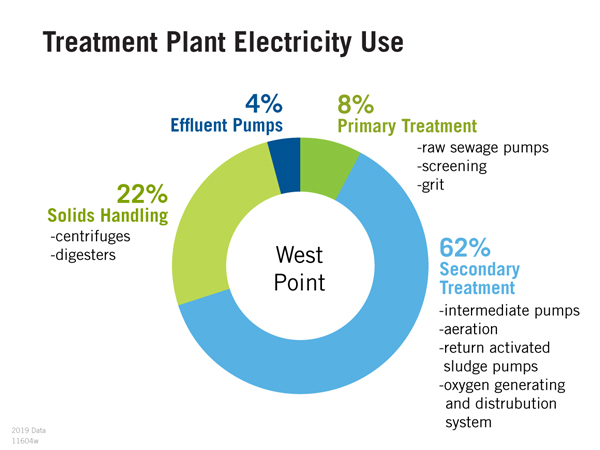
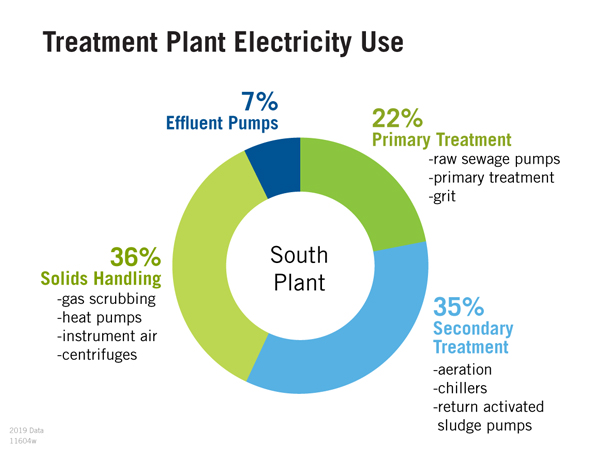
WTD facilities account for about 56% of all King County government's facility energy use, and almost 80% of that comes from WTD's three primary treatment plants: West Point, South Plant, and Brightwater. The energy used is not discretionary or wasteful—it's required to fulfill community needs.
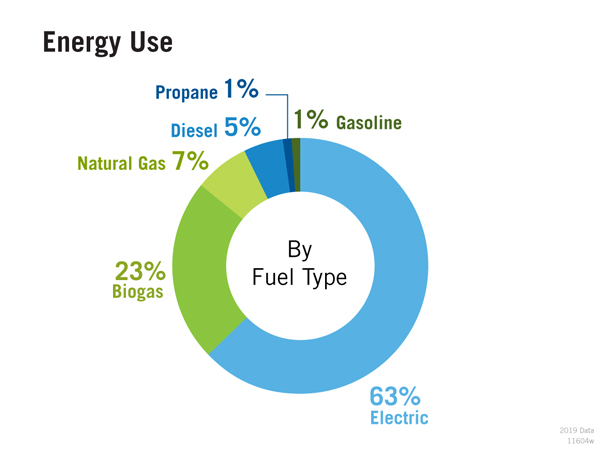
These graphs show what types of energy we use and where. As WTD continues to implement more streamlined processes and system upgrades, we expect these sources to shift over time as our facilities become more energy-efficient and we continue to develop sustainable energy solutions.
Facility and hauling 2021
Fuel type 2021
Electricity use 2021
Tracking performance
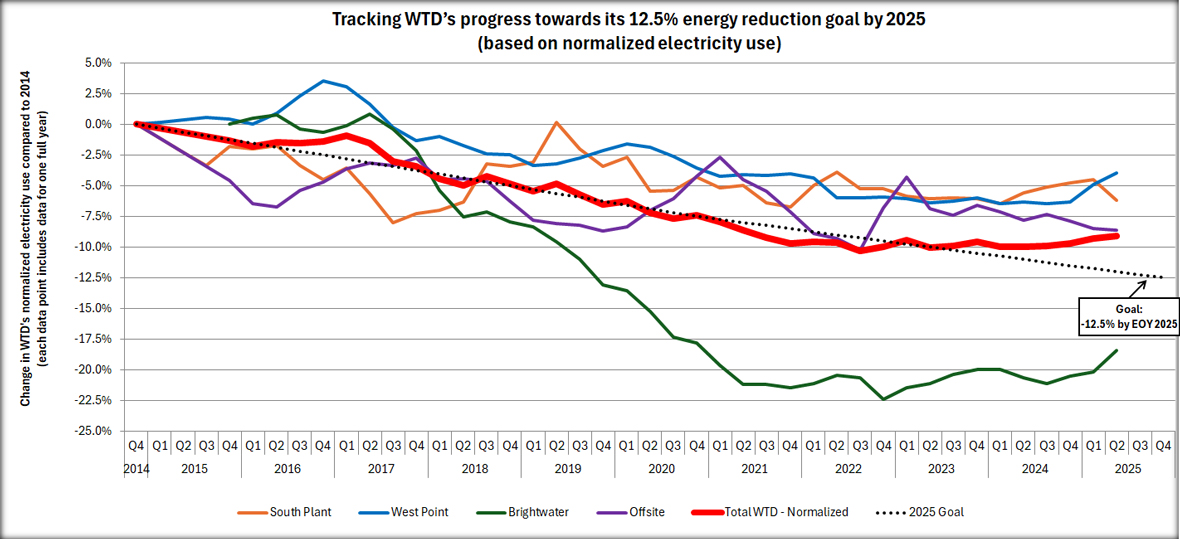
After normalizing WTD’s energy use, we compare WTD’s electricity consumption for each year against our baseline year (2014) to measure progress and demonstrate our performance. We set goals to reduce energy use at our treatment facilities of 12.5% by 2025 and 17.5% by 2030, and we are on track to reach these goals.
NOTE: WTD’s normalized energy use does not credit the energy we create and use on-site at any of our facilities, such as biogas. It measures pure efficiency of the energy we use at our facilities.